Debugging Node.js core  : stack trace
Up to this point printing variable content on screen, as I digged into Node.js internals, was sufficient. I wrote a bit about how variables in V8 were stored and how to go about creating helper functions needed to access their content. As the work progressed, it became clear that things had to get a bit more pro and called for more advanced debugging tools and techniques. This and the following post are highly inspired by the conversations and live coding sessions with the project mentor Franziska.
There are two useful ways of inspecting the Node.js code: complete stack trace (both C++ and JavaScript) and being able to step in the functions and log the contents of variables of interest. Here, I will focus on accessing the complete stack trace and more advanced use of lldb with Node.js are summarized in the follow-up.
Node.js maintains and develops llnode
![]() ,
which can be used to fill in the gaps in the JavaScript stack trace
(in addition to the C++ one, that is). Another option (possible
to use with XCode) is the jbt plug-in to lldb.
From my experience, both llnode and jbt are easy to install (all worked as
described in the install guidelines) and provide fairly similar
level of details. I personally opted for llnode as it is under active development
and guarded under the official Node.js umbrella.
,
which can be used to fill in the gaps in the JavaScript stack trace
(in addition to the C++ one, that is). Another option (possible
to use with XCode) is the jbt plug-in to lldb.
From my experience, both llnode and jbt are easy to install (all worked as
described in the install guidelines) and provide fairly similar
level of details. I personally opted for llnode as it is under active development
and guarded under the official Node.js umbrella.
To show an examples of how that could work in a practice, let us take a toy example:
'use strict';

require('../common');
var vm = require('vm');
const util = require('util');

const sandbox = {};
const context = vm.createContext(sandbox);

const code = `
   var globalVar = "set";
   var object = {value: 10};
   object.color = 'red';
`;

const res = vm.runInContext(code, context);

console.log(util.inspect(sandbox));
In the code snippet above, variables and objects are created inside the vm context. For reference on function calls see the vm API docs.
Assuming that Node.js is cloned locally (here I run it on master branch, v6.2.0), let us build the debug version
./configure --debug && make -j4
and call llnode from the command line on the test script
lldb ./node_g test.js
Calling help gives the current user-defined commands, in addition to the
lldb specific ones:
  findjsinstances -- List all objects which share the specified map.
  findjsobjects   -- Alias for `v8 findjsobjects`
  jsprint         -- Alias for `v8 inspect`
  jssource        -- Alias for `v8 source list`
  jsstack         -- Alias for `v8 bt`
  v8              -- Node.js helpers
We will set a breakpoint at one of the callbacks called when modifying
(in any way) properties on global objects inside the vm,
GlobalPropertySetterCallback. What we expect to see
is that the globalVar, object and foo1 will be copied onto an object
associated internally with new instance of a V8 Context,
so-called sandbox (process referred to as “contextifying” the sandbox).
This and other callbacks are defined in node_contextify.cc.
Next, we execute the script:
b node::ContextifyContext::GlobalPropertySetterCallback
r
The script stops when hitting the breakpoint in the
GlobalPropertySetterCallback.
bt command shows a number of frames with empty stack trace.
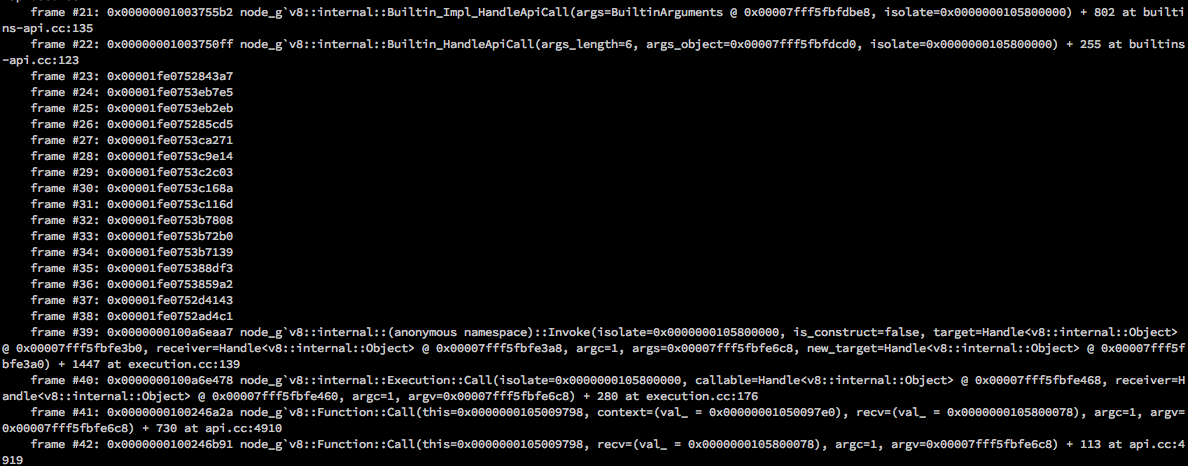
This is the executed JavaScript code and the point where llnode plug-in comes to rescue. Re-run of the command using llnode that lists the first 40 frames:
(lldb) v8 i 40
results in:
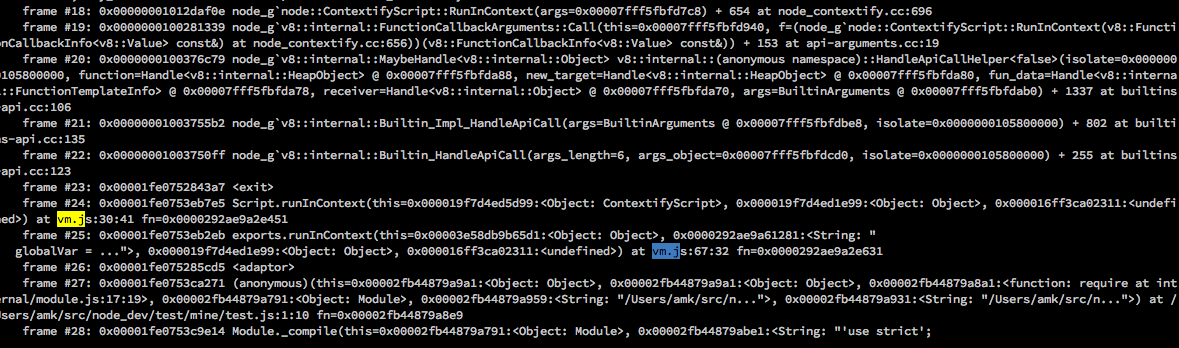
The place of interest is the vm.js file, where the commands (and thus the callbacks) created inside the context are called. Let us inspect the 0x000019f7d4ed1e99 Object, which corresponds to the global sandbox object.
(lldb) v8 i 0x000019f7d4ed1e99
    0x000019f7d4ed1e99:<Object: Object properties {
    .<non-string>=0x000019f7d4ed1f71:<unknown>,
    .<non-string>=0x000019f7d4ed5d29:<Object: no constructor>}>
As expected, before the Setter kicks in, it is an empty template object.
We continue (c) and see that the Setter copies the properties onto the
sandbox
(lldb) v8 i 0x000019f7d4ed1e99
 0x000019f7d4ed1e99:<Object: Object properties {
    .<non-string>=0x000019f7d4ed1f71:<unknown>,
    .<non-string>=0x000019f7d4ed5d29:<Object: no constructor>,
    .globalVar=0x000016ff3ca036b1:<String: "set">}>
and after the second pass of the setter:
(lldb)  v8 i 0x000019f7d4ed1e99
	0x000019f7d4ed1e99:<Object: Object properties {
    .<non-string>=0x000019f7d4ed1f71:<unknown>,
    .<non-string>=0x000019f7d4ed5d29:<Object: no constructor>,
    .globalVar=0x000016ff3ca036b1:<String: "set">,
    .object=0x000019f7d4ed5f21:<Object: Object>}>
We can further inspect the object property:
(lldb) v8 i 0x000019f7d4ed5f21
  0x000019f7d4ed5f21:<Object: Object properties {
    .value=<Smi: 10>,
    .color=0x000011aa8ee41c61:<String: "red">}>
The properties created in the global scope inside the vm will be copied onto the sandbox and visible from the JavaScript script.
console.log(util.inspect(sandbox));
reveals the modifications of the sandbox:
JavaScript
{ globalVar: 'set',
  object: { value: 10, color: 'red' }
 }
This obviously just scratches the surface of possible uses of llnode. When working on Node.js core we want to use the full capabilities of a debugger– move through the code and access V8 specific objects.