Debugging Node.js core  : lldb
Here we level up on Node.js core debugging. This time we will use lldb. Anyone coding in C++ most likely have used a debugger at some point in time. Depending on the system, it was either gdb or lldb. A debugger allows for the advancement of the program as we see fit, accessing object state, frames and much much more.
V8 5.5 has just landed in Node.js, which is very exciting. There are a number of improvements and extensions of the API, which will fix ES6 related issues.
Project mentor Franziska wrote a post on starting with the low-level debugging of Node.js core using commands specified in the .gdbinit file that ships with V8. Here, I cover the same concept using lldb and have a glance of what vm does behind the scenes. Initially I thought it would open the way for a broader discussion on the inner workings of vm and places for improvements (aka what the Outreachy project is about), but as I started writing it up, it became a bit overloaded with details. So here comes the technical aspect (the how) and the actual debugging cases (the what and why) addressing current vm issues will be granted their own pages.
These days I work on a Mac (for better or for worse), so lldb is
a natural go-to debugger. It is open-source and features a REPL, along with C++
and Python plugins. Similarly to gdb’s .gdbinit, lldb allows to define
an .ldbinit file with a custom set of commands to assist debugging.
As lldb comes bundles inside XCode by default, so it is possible to use all settings
from the command line in the IDE. To make it work in XCode one either needs to
execute source ~/.lldbinit in lldb to source the commands or
look at possible automatized
third-party solutions (not tested).
As mentioned, V8 comes bundled with a .gdbinit file that specifies a set of
useful helper lldb calls to print out the variables stored in its Handles, be it a Heap Object or a variable
wrapped in Local handles. The standard print command returns only address
in memory and not the values themselves. When .gdbinit file is placed in the
root directory it gets loaded when gdb starts. When using lldb the corresponding
.lldbinit file does the same trick. I translated the syntax from V8’s .gdbinit
to lldb for the purpose of this project (.lldbinit),
which saved the day when it comes to figuring out how things are orchestrated
together and debugging.
A useful thing to note about the placement of the .lldbinit file (if one wants it to be read
by the lldb, that is; else, it can live anywhere ![]() ):
):
lldb will read settings/aliases/commands from three files at startup, if they exist. First, it will read a ~/.lldbinit-debugger command file. If you are using the lldb command line interface, this is ~/.lldbinit-lldb. If you are using lldb inside a GUI debugger like Xcode this will be ~/.lldbinit- Xcode. This is a useful place to put settings that you want to apply only when a given lldb command interpreter is used.
Second, ~/.lldbinit is read.
Third, an .lldbinit file in the current working directory (where lldb is started) will be read.
Though beyond the scope of this write-up, it is worth noting
that Python bindings to lldb C++ API are easy to use and very flexible–
this brings customization to a whole new level (![]() ) and boils down
to including the .py script in the .ldbinit file (an example of how it is done).
One can create custom aliases, which will be documented
in the
) and boils down
to including the .py script in the .ldbinit file (an example of how it is done).
One can create custom aliases, which will be documented
in the help command and serve as a reminder of their functionality.
Also, I found this gdb-to-lldb cheatsheet
very useful.
Having the commands to inspect the variables at hand means we are good to go. We set up a simple test script:
'use strict';

require('../common');
var vm = require('vm');
const util = require('util');

const sandbox = {};
const context = vm.createContext(sandbox);

const code = `
   var globalVar = "set";
   var object = {value: 10};
   object.color = 'red';
`;

const res = vm.runInContext(code, context);

console.log(util.inspect(sandbox));
Our goal is to sneak-peak inside the named property interceptors , which intercept actions (query/get/set/enum/delete) on properties of a global object inside the vm. The interceptors retrieve variables and their values from the global object and copy into onto the sandbox. Currently, there are five interceptors. It is about to change as of V8 5.5. to account for proper treatment of the ES6 syntax.
In the above code we touch on the mechanisms currently in place when the properties are defined inside of the vm context. We run the process
lldb ./node_g test.js
and set the breakpoints in the
GlobalPropertyGetterCallback,
GlobalPropertySetterCallback callbacks and
CopyProperties
function in src/node_contextify.cc.
The breakpoints can be set by calling the functions themselves
(e.g. b node::ContextifyContext::CopyProperties incl. the namespace)
or at selected lines within a given file:
b node_contextify.cc:124
b node_contextify.cc:371
b node_contextify.cc:397
br list lists currently set breakpoints and br del #no removed
breakpoint #no. Another useful call is frame variable, which lists
the variables accessible within the current frame.
Note: when using the same breakpoints repeatedly we could save them to a file to be loaded when starting lldb (with the ‘-s’ flag).
r starts the process.
In our test case, the variables and properties, as defined in the vm,
are first intercepted by the getter (calling the GetProperty function)
listing the variables,
and then copied onto the sandbox by the setter. We use the commands defined
in the .lldbinit inspect the V8 specific objects.
For instance, to access current property key and its value after the second
breakpoint (we are in the setter), our go-to commands are:
(lldb) jlh *property
#globalVar
(lldb) jlh *value
#set
Here, jlh (“job local handle”) exposes V8 Objects unwrapped from the
v8::Local handle
(see this post
for a bit more background from the V8 team member ![]() ).
).
After the setter has looped twice, the sandbox looks as follows:
(lldb) jlh *ctx->sandbox()
0x2cabb695a381: [JS_OBJECT_TYPE]
 - map = 0x1f417eb3cb11 [FastProperties]
 - prototype = 0x2be445283f81
 - elements = 0x15d2fb302241 <FixedArray[0]> [FAST_HOLEY_ELEMENTS]
 - properties = {
   0x2be445282319 <Symbol: node:contextify:global>: 0x2cabb695a459 +
   <JS Global Object> (data field at offset 0)
   0x2be4452822c9 <Symbol: node:contextify:context>: 0x2cabb695e211 +
   <JS Object> (data field at offset 1)
   #globalVar: 0x15d2fb3036b1 <String[3]: set> (data field at offset 2)
   #object: 0x2cabb695e401 <an Object with map 0x1f417eb3cab9> (data field at offset 3)
 }
We see the the properties have been correctly attached to it. Side note: we can inspect sandbox using llnode by looking at the stack trace of the current frame (reminder):
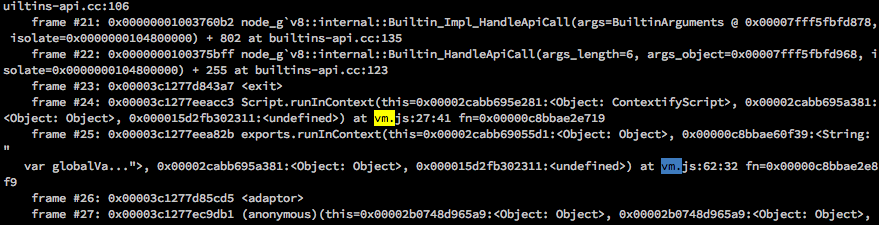
(lldb) v8 i 0x00002cabb695a381
0x00002cabb695a381:<Object: Object properties {
    .<non-string>=0x00002cabb695a459:<unknown>,
    .<non-string>=0x00002cabb695e211:<Object: no constructor>,
    .globalVar=0x000015d2fb3036b1:<String: "set">,
    .object=0x00002cabb695e401:<Object: Object>}>
(lldb)
The next breakpoint takes us to CopyProperties. CopyProperties is a temporary solution (as in: “when callbacks will be implemented for the ES6 syntax”, which is the case in V8 v.5.5) to take care of copying any properties that might have been missed by the shortcomings of the current implementation of interceptors, onto the sandbox implemented for the ES6 syntax”, which is the case in V8 v.5.5). In essence, it iterates over own properties of the global object, checks whether they are present on the sandbox, and if it is not the case, copies it over.
We can look at the variables in the current frame:
(lldb) frame variable
...
(v8::Local<v8::Context>) context = (val_ = 0x0000000104841088)
(v8::Local<v8::Object>) global = (val_ = 0x0000000104841098)
(v8::Local<v8::Object>) sandbox_obj = (val_ = 0x00000001048410b8)
(v8::Local<v8::Function>) clone_property_method = (val_ = 0x0000000000000000)
(v8::Local<v8::Array>) names = (val_ = 0x00000001048410c8)
which include the global object, sandbox and names, which are its own properties. Here, the sandbox has the properties we expect it to have
(lldb) jlh *names
 ...
 - elements = {
           0: 0x2a8dda4c9511 <String[9]: globalVar>
           1: 0x15d2fb302271 <String[6]: object>
 }
which will not always be the case.
One of the scenarios when GlobalPropertySetterCallback does not do its
job is when property is defined via Object.defineProperty.
This sets up the stage for working through the vm issues.